Matlab: Points and vectors in 3D-plots
Points and Vectors in 3D-Plots
(German) This matlabfunction creates vectors and points for the previous post in the 3D cartesian coordinate system.function punkt3D(x1,y1,z1,x2,y2,z2,sign,name,color,dx,dy,dz,true)
Therefor "startVec" are the initial values of the vector and "stopVec" the final values. You need the function (Cone/Arrow) and (Grid3D). The optional arguments are shown below. For example you can use it as:
figure;hold on;axis off;
grid3D([0,0,0], [1,1,1], 'Amount', [4,4,4], 'Axes', gca, 'MinorGrid','Arrow','AxTicks',[{['']},{['']},{['']}],...
'AxLabels',["";"";""]);
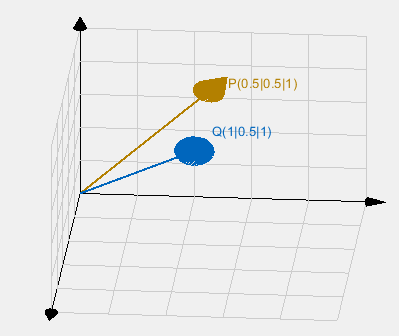
P = [0.5,0.5,1];
Q = [1,0.5,1];
point3D([0,0,0],P,'Marker','arrow','Label','P(0.5|0.5|1)','Color',[0.7 0.5 0]);
point3D([0,0,0],Q,'Marker','arrow','Label','Q(1|0.5|1)','Color',[0.0 0.4 0.74],'Deviation',[0,0,0.1]);
function point3D(startVec,stopVec,varargin)
% Input arguments:
% startVec ... input vector of the beginning of the point in [x,y,z]
% stopVec ... input vector of the ending of the point in [x,y,z]
%
% Optional input argument (varargin):
% 'Marker',sign ... defines the marker as '.' or 'arrow'
% 'LineWidth',LineWidth ... LineWidth of the vector
% 'Color',color ... define the color of the arrow/point
% 'Deviation',devVec ... defines the deviation to the point of the label
% 'Label',name ... defines the label of the point/arrow.
% 'PlotProjection' ... plot the projection from 0 to the point
if isempty(varargin)
varargin{1} = '';
end
[logic, index] = max(strcmp(varargin,'Marker'));
if logic
sign = varargin{index+1};
else
sign = '.';
end
[logic, index] = max(strcmp(varargin,'LineWidth'));
if logic
LineWidth = varargin{index+1};
else
LineWidth = 1.5;
end
[logic, index] = max(strcmp(varargin,'Color'));
if logic
color = varargin{index+1};
else
color = [0 0 0];
end
[logic, index] = max(strcmp(varargin,'Label'));
if logic
name = varargin{index+1};
else
name = '';
end
[logic, index] = max(strcmp(varargin,'Deviation'));
if logic
devVec = varargin{index+1};
dx = devVec(1);
dy = devVec(2);
dz = devVec(3);
else
dx=0;
dy=0;
dz=0;
end
x1 = startVec(1);
y1 = startVec(2);
z1 = startVec(3);
x2 = stopVec(1);
y2 = stopVec(2);
z2 = stopVec(3);
[logic, ~] = max(strcmp(varargin,'PlotProjection'));
if logic
plot3([0 x2],[y2 y2],[z2 z2],'--','Color',[0.8 0.8 0.8]);
plot3([x2 x2],[0 y2],[z2 z2],'--','Color',[0.8 0.8 0.8]);
plot3([x2 x2],[y2 y2],[0 z2],'--','Color',[0.8 0.8 0.8]);
end
if strcmp(sign,'arrow') == 1
xrange = x2-x1;
yrange = y2-y1;
zrange = z2-z1;
arrow3D([x2,y2,z2],[x2+xrange/7,y2+yrange/7,z2+zrange/7],'Length',1,'Thickness',1,'Color',color);
else
p2 = plot3(x2, y2, z2,sign,'Color',color,'Markersize',7);
end
p1 = plot3([x1 x2],[y1 y2],[z1 z2],'LineWidth',LineWidth);
p3 = text(x2+x2/10+dx, y2+y2/7+dy, z2+z2/10+dz,name);
set([p1 p3],'Color',color);
end


Kommentare
Kommentar veröffentlichen