Posts

Es werden Posts vom 2022 angezeigt.

Easy Plots in HTML/PHP with Google Charts

Bild
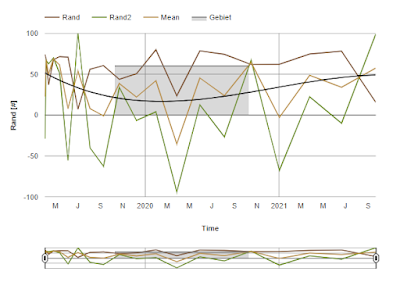
With this function Plots.php it is very easy to make plots in php. You only need to define an array and the parameters you want to show.  PHP/Plots.php at main · PhysIngo/PHP (github.com) Online Code We first generate very easy artificial data like this. We fill a array with time vals and random values and numbers to display different stuff. $newArr = array(); for ($i=0;$i<20;$i++){   $val = 1554241121+60*60*60*$i*$i;   $newArr[$i]["Time"] = gmdate("Y-m-d h:i:s",$val);   $newArr[$i]["Rand"] = 8*sqrt(abs(100*(sin($val))));   $newArr[$i]["Rand2"] = 100*cos(4*$val)*cos($val);      $newArr[$i]["Mean"] = ($newArr[$i]["Rand"]+$newArr[$i]["Rand2"])/2;   $newArr[$i]["Months"] = gmdate("F",$val);   $newArr[$i]["Days"] = gmdate("j",$val);   $newArr[$i]["Days2"] = gmdate("n",$val); } General Settings // general string $paramsname = array("Time","Rand&

Matlab: 3D Coordinate System Rotations with Vectors

Bild
This post describes how to switch/transform between corrdinate systems in Matlab and how this can be represented. There are 3 functions that are crucial here: grid3D(startVec, stopVec, varargin) ... Creates an orthogonal grid in 3D depending on start and end point (diagonal of a cube) and draws ticks, labels and MinorGrids. Rotations can be performed here to show how to transform between Cartesian corrdinate systems. point3D(startVec, stopVec, varargin) ... Is a function to create 3D vectors based on start and end points. It includes options like naming the points, displaying them as arrows, as well as settings for color and thickness. arrow3D(startVec, stopVec, varargin) ... This function creates an arrow in 3D that can be scaled by the options. The functions including example can be downloaded here: Matlab-Functions/CartesianCorrdinateTransformation at main · PhysIngo/Matlab-Functions (github.com) First of all an example where the 1 coordinate system with 2 vectors is rotated 2 times