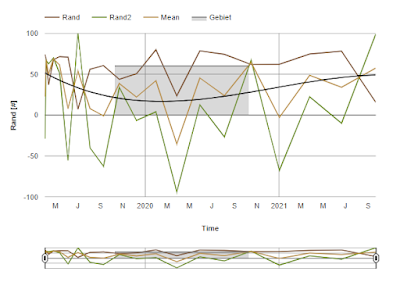
Easy Plots in HTML/PHP with Google Charts

With this function Plots.php it is very easy to make plots in php. You only need to define an array and the parameters you want to show. PHP/Plots.php at main · PhysIngo/PHP (github.com) Online Code We first generate very easy artificial data like this. We fill a array with time vals and random values and numbers to display different stuff. $newArr = array(); for ($i=0;$i<20;$i++){ $val = 1554241121+60*60*60*$i*$i; $newArr[$i]["Time"] = gmdate("Y-m-d h:i:s",$val); $newArr[$i]["Rand"] = 8*sqrt(abs(100*(sin($val)))); $newArr[$i]["Rand2"] = 100*cos(4*$val)*cos($val); $newArr[$i]["Mean"] = ($newArr[$i]["Rand"]+$newArr[$i]["Rand2"])/2; $newArr[$i]["Months"] = gmdate("F",$val); $newArr[$i]["Days"] = gmdate("j",$val); $newArr[$i]["Days2"] = gmdate("n",$val); } General Settings // general string $paramsname = array("Time","Rand...