Matlab: Optical composition
Optical composition with Matlab
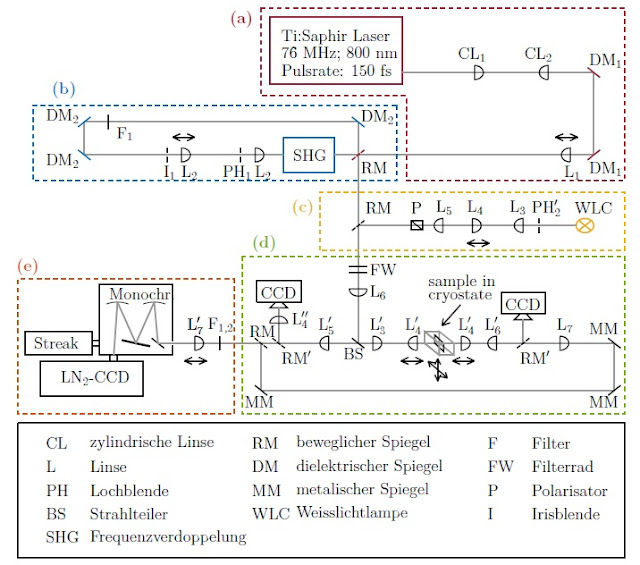
(German) This post is about the representation of optical compositions existing of lenses, mirror and other optics. Therefore I programmed a few functions which are described below (MATLAB files):opticlense(x,y,deg,thick,dx,dy,color)
opticbeamsplitter(x,y,deg,thick,dx,dy,color)
opticbikonvex(x,y,deg,thick,dx,dy,color)
opticdistance(x1,y1,x2,y2,string,len,thick,color)
opticline(x,y,deg,len,thick,color)
opticmirror(x,y,deg,style,thick,color,len)
opticslit(x,y,deg,thick,color,len)
Therefor x and y are the positions of the optical element. The optics are positioned scaled. deg is the angle of the inclination and dx, dy and len the length in x, y direction. color is the color and thick the thickness of the line. In opticdistance x1,y1 are initial values and x2,y2 the final valueswhere string stands for the name (for example the distance). In opticmirror style as the value 0 returns a normal mirror and for the value 1 a dashed mirror. The following figure shows my composition of my bachelorthesis included as a .tikz picture in latex.:
Quellsource:
clear all;clc;
fig(1) = figure(1);
clf(1);
hold on;
box off;
axis off;
xLaser = [-11.4 -2.4 -2.4 -11.4 -11.4];
yLaser = [2 2 7.7 7.7 2];
text(-11,6,'Ti:Saphir Laser','interpreter','Latex')
text(-11,4.6,'76 MHz; 800 nm','interpreter','Latex')
text(-11,3.2,'Pulsrate: 150 fs')
plot(xLaser,yLaser,'Color',colors('darkred'),'linewidth',1.15);
xbLaser = [-7 -10.5 -10.5 -7 -7];
ybLaser = [-5.5 -5.5 -2.5 -2.5 -5.5];
text(-10.2,-4,'SHG')
plot(xbLaser,ybLaser,'Color',colors('blue'),'linewidth',1.15);
%xLight = [12.2 9.1 9.1 12.2 12.2];
%yLight = [-12 -12 -10 -10 -12];
opticlense(10,-10,45,1,1.2,1.2,colors('yellow'));
opticlense(10,-10,225,1,1.2,1.2,colors('yellow'));
opticlense(10,-10,135,1,1.2,1.2,colors('yellow'));
opticlense(10,-10,315,1,1.2,1.2,colors('yellow'));
text(8.9,-8.5,'WLC','interpreter','latex')
%plot(xLight,yLight,'Color',colors('yellow'),'linewidth',1.15);
xSpec = [-18 -18 -23 -23 -18 -18];
ySpec = [-19.8 -15 -15 -21 -21 -20.2];
text(-22.7,-15.8,'Monochr.');
plot(xSpec,ySpec,'Color',[0 0 0],'linewidth',1.15);
opticline(-19,-20,45);
xmono = [-20:0.1:-18.5];
xmono2 = [-22.5:0.1:-21];
opticline(-20.5,-20,15,2,1.6);
plot(xmono,-21.5+5*cos((xmono+19.25)*0.35),'Color',[0 0 0]);
plot(xmono2,-21.5+5*cos((xmono2+21.75)*0.35),'Color',[0 0 0]);
xSpecc = [-21.75 -22.25 -22.25 -21.75 -21.75];
ySpecc = [-21 -21 -21.5 -21.5 -21];
plot(xSpecc,ySpecc,'Color',[0 0 0],'linewidth',1.15);
xSpecb = [-23.5 -23 -23 -23.5 -23.5];
ySpecb = [-19.75 -19.75 -20.25 -20.25 -19.75];
plot(xSpecb,ySpecb,'Color',[0 0 0],'linewidth',1.15);
xStreak = [-20 -27 -27 -20 -20];
yStreak = [-24.5 -24.5 -21.5 -21.5 -24.5];
text(-26,-23,'LN$_2$-CCD','interpreter','latex');
plot(xStreak,yStreak,'Color',[0 0 0],'linewidth',1.15);
xspec2 = [-23.5 -28 -28 -23.5 -23.5];
yspec2 = [-19 -19 -21 -21 -19];
text(-27.8,-20,'Streak');
plot(xspec2,yspec2,'Color',[0 0 0],'linewidth',1.15);
xUSB1 = [-12.3 -9.3 -9.3 -12.3 -12.3];
yUSB1 = [-16.5 -16.5 -14.7 -14.7 -16.5];
plot(xUSB1,yUSB1,'Color',[0 0 0],'linewidth',1.15);
plot([-10.6 -11 -11.4 -10.2 -10.6],[-16.5 -16.5 -17 -17 -16.5],'Color',[0 0 0],'linewidth',1.15);
text(-12.4,-15.7,'CCD')
xUSB2 = [7.3 4.3 4.3 7.3 7.3];
yUSB2 = [-17.5 -17.5 -15.7 -15.7 -17.5];
plot([5.6 6 6.4 5.2 5.6],[-17.5 -17.5 -18 -18 -17.5],'Color',[0 0 0],'linewidth',1.15);
plot(xUSB2,yUSB2,'Color',[0 0 0],'linewidth',1.15);
text(4.2,-16.7,'CCD')
%opticdistance(-2.4,3,18.6,3,'105 cm');
%opticdistance(23,-4,23,-6,'10 cm');
%opticdistance(23,-6,23,-19,'115 cm');
%opticdistance(23,-19,23,-20.5,'7.5 cm');
%opticdistance(18.6,-8.5,-5.4,-8.5,'120 cm');
%opticdistance(-12,-22,12,-22,'120 cm');
plot([-2.4 10.6],[3 3],'-','Color',[0.6 0.6 0.6],'linewidth',1.3);
%plot([0 0],[0 -4],'-','Color',[0.6 0.6 0.6],'linewidth',1.3);
%plot([0 10.6],[-4 -4],'-','Color',[0.6 0.6 0.6],'linewidth',1.3);
plot([10.6 10.6],[3 -4],'-','Color',[0.6 0.6 0.6],'linewidth',1.3);
plot([10.6 -5.4],[-4 -4],'-','Color',[0.6 0.6 0.6],'linewidth',1.3);
plot([-5.4 -7],[-4 -4],'-','Color',[0.6 0.6 0.6],'linewidth',1.3);
plot([-10.5 -24],[-4 -4],'-','Color',[0.6 0.6 0.6],'linewidth',1.3);
plot([-24 -24],[-4 -1.2],'-','Color',[0.6 0.6 0.6],'linewidth',1.3);
plot([-24 -5.4],[-1.2 -1.2],'-','Color',[0.6 0.6 0.6],'linewidth',1.3);
plot([-5.4 -5.4],[-1.2 -20],'-','Color',[0.6 0.6 0.6],'linewidth',1.3);
plot([-5.4 9.4],[-10 -10],'-','Color',[0.6 0.6 0.6],'linewidth',1.3);
%plot([-2.4 -2.4],[-9.5 -11],'-','Color',[0.6 0.6 0.6],'linewidth',1.3);
%plot([-2.4 12.2],[-11 -11],'-','Color',[0.6 0.6 0.6],'linewidth',1.3);
plot([-5.4 5],[-20 -20],'-','Color',[0.6 0.6 0.6],'linewidth',1.3);
plot([5 12],[-20 -20],'-','Color',[0.6 0.6 0.6],'linewidth',1.3);
plot([12 12],[-20 -24],'-','Color',[0.6 0.6 0.6],'linewidth',1.3);
plot([12 -12],[-24 -24],'-','Color',[0.6 0.6 0.6],'linewidth',1.3);
plot([-12 -12],[-24 -20],'-','Color',[0.6 0.6 0.6],'linewidth',1.3);
plot([-10.8 -10.8],[-20 -17],'-','Color',[0.6 0.6 0.6],'linewidth',1.3);
plot([-12 -5.4],[-20 -20],'-','Color',[0.6 0.6 0.6],'linewidth',1.3);
plot([-12 -19],[-20 -20],'-','Color',[0.6 0.6 0.6],'linewidth',1.3);
plot([5.8 5.8],[-20 -18],'-','Color',[0.6 0.6 0.6],'linewidth',1.3);
plot([-19 -19.25],[-20 -16.5],'-','Color',[0.6 0.6 0.6],'linewidth',1.3);
plot([-19.25 -20.5],[-16.5 -20],'-','Color',[0.6 0.6 0.6],'linewidth',1.3);
plot([-20.5 -21.75],[-20 -16.5],'-','Color',[0.6 0.6 0.6],'linewidth',1.3);
plot([-21.75 -22],[-16.5 -21],'-','Color',[0.6 0.6 0.6],'linewidth',1.3);
%Bereiche
xba = [-12 -12 -2.1 -2.1 12.7 12.7 -12];
yba = [8.5 1 1 -6.2 -6.2 8.5 8.5];
plot(xba,yba,'--','Color',colors('darkred'),'linewidth',1.15);
text(-14.5,7.5,'\textbf{(a)}','Color',colors('darkred'),'interpreter','latex');
xbb = [-2.8 -2.8 -27.5 -27.5 -2.8];
ybb = [0.2 -6.2 -6.2 0.2 0.2];
plot(xbb,ybb,'--','Color',colors('blue'),'linewidth',1.15);
text(-26.6,1.5,'\textbf{(b)}','Color',colors('blue'),'interpreter','latex');
xbc = [-8 -8 12.7 12.7 -8];
ybc = [-12.1 -7.2 -7.2 -12.1 -12.1];
plot(xbc,ybc,'--','Color',colors('yellow'),'linewidth',1.15);
text(-10.3,-8.5,'\textbf{(c)}','Color',colors('yellow'),'interpreter','latex');
xbd = [-13.3 -13.3 12.7 12.7 -13.3];
ybd = [-12.6 -26 -26 -12.6 -12.6];
plot(xbd,ybd,'--','Color',colors('green'),'linewidth',1.15);
text(-13,-11.5,'\textbf{(d)}','Color',colors('green'),'interpreter','latex');
xbd = [-13.8 -13.8 -28.5 -28.5 -13.8];
ybd = [-14.5 -26 -26 -14.5 -14.5];
plot(xbd,ybd,'--','Color',colors('orange'),'linewidth',1.15);
text(-29,-13.5,'\textbf{(e)}','Color',colors('orange'),'interpreter','latex');
%
%xp = [-0.6 -0.6 -1.8 -1.8 -0.6];
%yp = [0.3 -0.3 -0.3 0.3 0.3];
%plot(xp,yp,'Color',[0 0 0],'linewidth',1.15);
%text(-2.0,1,'Cw')
%opticmirror(0,0,45,0,1.15,colors('darkred'));
%opticmirror(0,-4,45,0,1.15,colors('darkred'));
opticlense(2.5,3,90);
text(1,4.5,'$\text{CL}_1$','interpreter','latex');
opticlense(7.5,3,-90);
text(5.5,4.5,'$\text{CL}_2$','interpreter','latex');
%opticline(9.4,-4,90);
%text(8,-3,'$\nicefrac{\lambda}{2}$','interpreter','latex');
%opticbeamsplitter(10.6,-4,90);
%text(10.3,-3,'Pbs','interpreter','latex');
%opticline(10.6,-5,-45);
%text(10.7,-5,'Gp','interpreter','latex');
opticmirror(10.6,3,45,0,1.15,colors('darkred'));
text(9.9,4,'$\text{DM}_1$','interpreter','latex');
opticmirror(10.6,-4,-45,0,1.15,colors('darkred'));
text(9.9,-5.2,'$\text{DM}_1$','interpreter','latex');
opticlense(9,-4,-90);
text(8.2,-5.5,'$\text{L}_1$','interpreter','latex');
arrow2D(8,-2.5,180,[0 0 0],6,6,1.15);
arrow2D(9.5,-2.5,0,[0 0 0],6,6',1.15);
plot([8 9.5],[-2.5 -2.5],'k','linewidth',1.15);
%opticslit(16.2,-6,90);
%blue light
opticmirror(-5.4,-4,-45,1,1.15,colors('darkred'));
text(-5.6,-5.1,'RM','interpreter','latex');
opticlense(-12.4,-4,90);
text(-12.8,-5.5,'$\text{L}_2$','interpreter','latex');
text(-15,-5.5,'$\text{PH}_1$','interpreter','latex');
opticslit(-13.4,-4,90);
opticlense(-17.4,-4,90);
text(-17.8,-5.5,'$\text{L}_2$','interpreter','latex');
arrow2D(-18,-2.5,180,[0 0 0],6,6,1.15);
arrow2D(-16.5,-2.5,0,[0 0 0],6,6,1.15);
plot([-18 -16.5],[-2.5 -2.5],'k','linewidth',1.15);
text(-19,-5.5,'$\text{I}_1$','interpreter','latex');
opticslit(-18.4,-4,90);
opticmirror(-24,-4,45,0,1.15,colors('blue'));
text(-27,-0.7,'$\text{DM}_2$','interpreter','latex');
opticmirror(-24,-1.2,-45,0,1.15,colors('blue'));
text(-27,-4.5,'$\text{DM}_2$','interpreter','latex');
opticline(-22.4,-1.2,90);
text(-22.2,-2.2,'$\text{F}_1$','interpreter','latex');
opticmirror(-5.4,-1.2,45,0,1.15,colors('blue'));
text(-5.6,-0.8,'$\text{DM}_2$','interpreter','latex');
%white light
text(-5.3,-8.5,'RM','interpreter','latex');
opticmirror(-5.4,-10,-45,1);
opticbeamsplitter(-1.4,-10,90);
text(-2.2,-8.5,'P','interpreter','latex');
opticlense(0.35,-10,-90);
text(-0.5,-8.5,'$\text{L}_5$','interpreter','latex');
opticlense(2.35,-10,90);
text(1.6,-8.5,'$\text{L}_4$','interpreter','latex');
opticlense(5.8,-10,-90);
text(4.5,-8.5,'$\text{L}_3$','interpreter','latex');
arrow2D(2,-11.5,180,[0 0 0],6,6,1.15);
arrow2D(3.5,-11.5,0,[0 0 0],6,6,1.15);
plot([2 3.5],[-11.5 -11.5],'k','linewidth',1.15);
opticslit(6.9,-10,90);
text(6,-8.5,'$\text{PH}_2''$','interpreter','latex');
%all three
%opticline(-5.4,-9.5,0);
%text(-5,-9.5,'Cw','interpreter','latex')
opticline(-5.4,-13.5,0);
text(-5,-13.75,'FW','interpreter','latex');
opticline(-5.4,-14,0);
opticlense(-5.4,-15.4,180);
text(-5,-15.7,'$\text{L}_6$','interpreter','latex');
opticmirror(-5.4,-20,45);
text(-6.8,-20.9,'BS','interpreter','latex');
opticlense(-4.4,-20,90);
text(-5,-18.5,'$\text{L}_3''$','interpreter','latex');
opticlense(-1.4,-20,-90);
text(-2.6,-18.5,'$\text{L}_4''$','interpreter','latex');
%CRYOSTAT
xcry3 = [0.1 0.1 1.1 1.1 0.1];
ycry3 = [-20 -19 -20 -21 -20];
plot(xcry3,ycry3,'Color',[0.6 0.6 0.6],'linewidth',1.15);
xcry = [-0.2 -0.2 0.4 0.4 -0.2];
ycry = [-20 -19.3 -20 -20.7 -20];
plot(xcry,ycry,'k','linewidth',1.15);
plot([1.1 0.1],[-21 -21],'Color',[0.6 0.6 0.6],'linewidth',1.15);
plot([1.1 0.1],[-20 -20],'Color',[0.6 0.6 0.6],'linewidth',1.15);
plot([0.1 -0.9],[-19 -19],'Color',[0.6 0.6 0.6],'linewidth',1.15);
xcry2 = [-0.9 -0.9 0.1 0.1 -0.9];
ycry2 = [-20 -19 -20 -21 -20];
plot(xcry2,ycry2,'Color',[0.6 0.6 0.6],'linewidth',1.15);
xend = [-0.9 -0.9 0.1 0.1 -0.9];
yend = [-20 -19 -20 -21 -20];
plot(xend,yend,'Color',[0.6 0.6 0.6],'linewidth',1.15);
%doublearrwow
arrow2D(-1,-21.5,0,[0 0 0],6,6,1.15);
arrow2D(-2.5,-21.5,180,[0 0 0],6,6,1.15);
plot([-2.5 -1],[-21.5 -21.5],'k','linewidth',1.15);
arrow2D(1,-21.5,180,[0 0 0],6,6,1.15);
arrow2D(2.5,-21.5,0,[0 0 0],6,6,1.15);
plot([2.5 1],[-21.5 -21.5],'k','linewidth',1.15);
arrow2D(0,-21.3,90,[0 0 0],4,6,1.15);
arrow2D(0,-23.2,-90,[0 0 0],4,6,1.15);
plot([0 0],[-21.3 -23.2],'k','linewidth',1.15);
arrow2D(-0.65,-21.55,135,[0 0 0],5,5,1.15);
arrow2D(0.65,-22.95,-45,[0 0 0],5,5',1.15);
plot([-0.65 +0.65],[-21.55 -22.95],'k','linewidth',1.15);
%opticline(0.1,-19,90);
arrow2D(0.3,-18.5,233,[0 0 0],6,6,1.15);
plot([0.3 0.3+0.5*2.5],[-18.5 -18.5+0.707*2.5],'k','linewidth',1.15);
text(-1,-14.8,'sample in');
text(-1,-16,'cryostate');
opticlense(1.6,-20,90);
text(1.0,-18.5,'$\text{L}_4''$','interpreter','latex');
text(2.8,-18.5,'$\text{L}_6''$','interpreter','latex');
opticlense(4,-20,-90);
text(7.7,-18.5,'$\text{L}_7$','interpreter','latex');
opticlense(8.3,-20,90);
opticmirror(5.8,-20,-45,1);
text(5.2,-21.2,'$\text{RM}''$','interpreter','latex');
opticmirror(-12,-20,45,1);
text(-11.0,-21.2,'$\text{RM}''$','interpreter','latex');
text(-13.2,-19,'$\text{RM}$','interpreter','latex');
text(-8.5,-18.5,'$\text{L}_5''$','interpreter','latex');
opticlense(-7.4,-20,-90);
text(-10.3,-18,'$\text{L}_4''''$','interpreter','latex');
opticlense(-10.8,-18.3,0);
text(-13.5,-25,'MM');
opticmirror(-12,-24,+45);
text(9.9,-25,'MM');
opticmirror(12,-24,-45);
text(9.9,-18.8,'MM');
opticmirror(12,-20,+45);
%text(-10.2,-18,'RM','interpreter','latex');
opticmirror(-10.8,-20,45,1);
opticline(-14.8,-20,90);
text(-16.0,-18.5,'$\text{F}_{\text{1,2}}$','interpreter','latex');
text(-17.4,-18.5,'$\text{L}_7''$','interpreter','latex');
opticlense(-16.5,-20,90);
arrow2D(-15.7,-21.5,0,[0 0 0],6,6,1.15);
arrow2D(-17.2,-21.5,180,[0 0 0],6,6,1.15);
plot([-17.2 -15.7],[-21.5 -21.5],'k','linewidth',1.15);
text(-17.4,-18.5,'$\text{L}_7''$','interpreter','latex');
xl = [-28.5 12.7 12.7 -28.5 -28.5];
yl = [-26.8 -26.8 -38.2 -38.2 -26.8];
plot(xl,yl,'k','linewidth',1.15);
text(-27,-28.5,'CL');
text(-24,-28.5,'zylindrische Linse');
text(-27,-30.5,'L');
text(-24,-30.5,'Linse');
text(-27,-32.5,'PH');
text(-24,-32.5,'Lochblende');
text(-27,-34.5,'BS');
text(-24,-34.5,'Strahlteiler');
text(-27,-36.5,'SHG');
text(-24,-36.5,'Frequenzverdoppelung');
text(-13,-28.5,'RM');
text(-10,-28.5,'beweglicher Spiegel');
text(-13,-30.5,'DM');
text(-10,-30.5,'dielektrischer Spiegel');
text(-13,-32.5,'MM');
text(-10,-32.5,'metalischer Spiegel');
text(3,-34.5,'I');
text(6,-34.5,'Irisblende');
text(3,-28.5,'F');
text(6,-28.5,'Filter');
text(3,-30.5,'FW');
text(6,-30.5,'Filterrad');
text(3,-32.5,'P');
text(6,-32.5,'Polarisator');
text(-13,-34.5,'WLC');
text(-10,-34.5,'Weisslichtlampe');
%set(gca, 'linewidth',1.5);
xlim([-29 13]);
%ylim([-23.5 8]);
%set(findall(gcf,'-property','FontSize'),'FontSize',10)
%set(findobj(gcf,'-property','FontSize'),'FontSize',10)
matlab2tikz('compositionneu.tikz', 'height', '\figureheight', 'width', '\figurewidth', 'figurehandle', fig(1));


Kommentare
Kommentar veröffentlichen